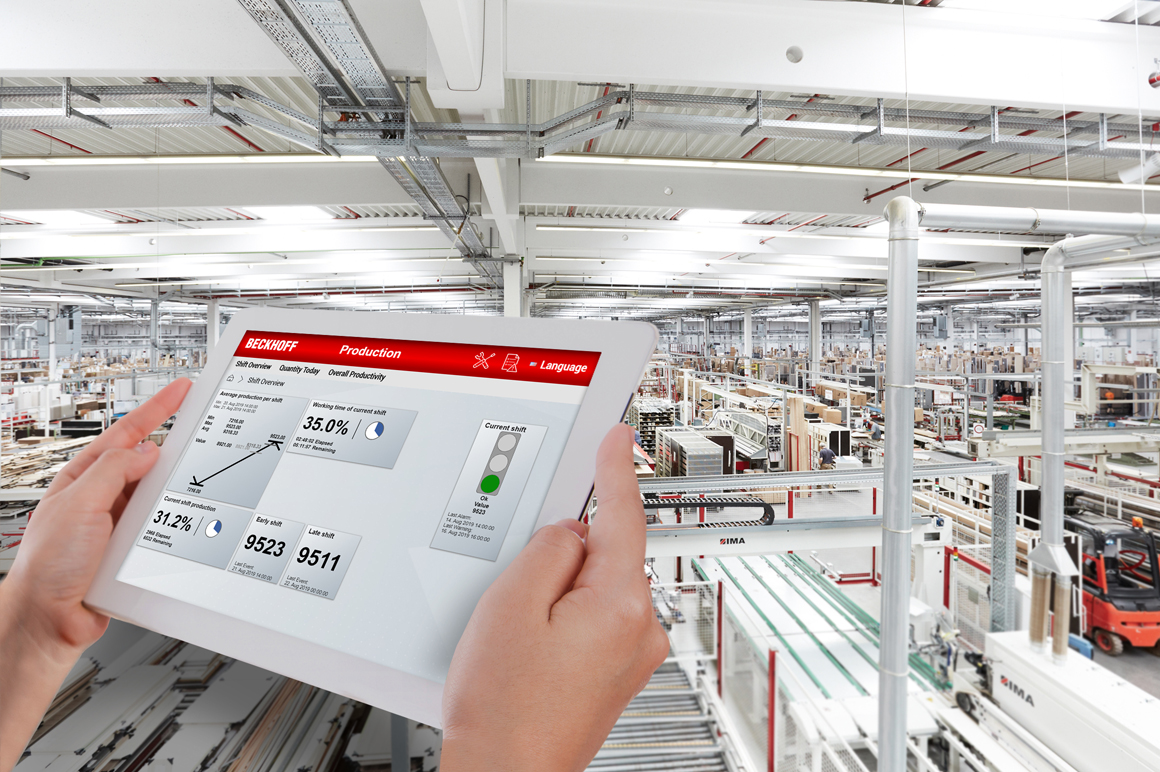

TwinCAT Analytics 软件工具用于分析一台本地设备或多台分布式设备中的数据。TwinCAT Analytics 产品系列包含完整的数据分析工作流程,包括各种用于分析实时数据和历史数据的算法。通过 TwinCAT Analytics 软件处理成有价值的信息并为企业决策提供依据,数据就是这个分析工作流程中的“原材料”。
我们的数据价值链 — TwinCAT Analytics 的流程步骤
下面,我们将带您了解完整的数据分析流程:从原始数据的采集到采取可行的措施以及优化策略,当然,所有这一切都完全基于 TwinCAT Analytics。

第 1 步:原始数据采集
数据究竟从何而来?
数据分析的质量取决于数据本身的质量(“garbage in – garbage out,错进错出”)。因此,原始数据采集是数据价值创造过程的起点。若想成功进行数据分析,必须非常清楚哪些数据用于哪些目的,以及记录变化的速度(采样率)。TwinCAT Analytics 为连续采集过程图像提供多个功能选项。高采样率有助于实时获取大量高质量的数据,为成功分析数据和建模奠定基础。使用 TwinCAT 3 Analytics Logger 可以实现最佳效果,但也可以使用其它应用成熟的技术和产品,如 TwinCAT 3 Scope View 或 TwinCAT 3 Database Server 。

第 2 步:数据存储和通信
数据如何从采集地点进入到我的分析中?
数据存储在哪里?有哪些访问选项?
在数据采集完成之后或在数据采集过程中,数据必须被传输或存储。我们的产品可为用户提供各种可能性。实时数据可以直接通过 ADS 或 MQTT 传输,以便用于实时分析。如果最初是在本地目标系统上或在网络中用 TwinCAT 3 Analytics Storage Provider 存储历史数据,则可以将分析文件迁移到另一个系统中,便于日后存档。还可以导入数据库或导出为其它文件格式。

步骤 3:数据准备和探索性(预)分析
如何进行数据处理分析?
如何设计有针对性的分析?
在很多情况下,数据预处理以及探索性预分析是通往数据分析成功之路的最重要步骤。因为一开始数据是一团乱的,根本不清楚哪些数据流需要使用哪些算法进行处理才能实现有意义的、能够提供预期结果和行动方案建议的数据分析链。因此,必须首先要定义哪些数据流是相关联的,必要时按照时间段和事件进行定义。TwinCAT 3 Analytics Workbench 和 TwinCAT 3 Analytics Service Tool 中集成的 Data Scout(数据探测)功能可以实现这一点。通过它可以快速概览各个数据集,也能够切割和连接不同数据集中的数据,以便形成一个新的数据流。在选择好合适的数据后,还需要找到合适的算法和链接。因此,集成有配置程序的 TwinCAT 3 Analytics Workbench 提供了最大可行性。用户可以轻松将工具箱中的各种算法拖放到配置程序中,将它们与数据及其它算法关联起来,并根据用户的想法设置它们的参数。如果用户需要定制算法,也可以使用新的 Analytics Lambda 函数并借助向导扩展现有的算法。

第 4 步:24/7 全天候数据采集、数据分析并集成到系统中
用哪种方式可以永久、持续地使用所创建的分析模型?
在确定了相关数据后,可以选中它,进行连续的数据采集。为此可以再次配置 TwinCAT Analytics Logger;它在控制系统运行期间写入选定的数据流,从而实现连续的数据采集。自动代码生成允许由先前在 Workbench 中创建的针对特定问题的数据分析链生成 PLC 代码。然后可以将它永久地集成到系统运行中,并对记录的数据进行 24/7 全天候分析。这样就能够及时和有预见性地发现可能出现的错误,甚至能够在经过很长一段时间后发现数据相关性以及优化潜力。
产品

TE1300 | TwinCAT 3 Scope View Professional
TwinCAT 3 Scope View 是一款软件示波器,用于通过各种绘图工具以图形方式显示信号曲线。例如 YT、XY、条形图或数字图表。Scope View 专业版是 Scope View 基础版的扩展,包含在 TwinCAT 3 XAE 中,具有更多功能。主要用于长时间跟踪和监控处理过程。

TE3500 | TwinCAT 3 Analytics Workbench
TwinCAT 3 Analytics Workbench 是一款 TwinCAT 3 开发环境产品,用于创建持续数据分析。这些数据可来自多种应用场景,例如工业设备、楼宇系统或能源设施等。工作台的配置集成在 Microsoft Visual Studio 中,并以图形用户界面的形式呈现。工具箱提供多种用于配置分析的算法选项:

TE3510 | TwinCAT 3 Analytics Vision
TwinCAT 3 Analytics Vision 提供了一种选项,可以通过简单的图形化表示来配置和测试应用程序中的视觉算法。用户无需具备编程技能。只需按下按钮,即可从配置中自动生成基于 TF7xxx 系列视觉产品的 PLC 代码以及基于HTML 的图形用户界面。生成的代码可集成到设备控制系统中并在本地执行。或者,也可将代码加载到远程设备,并在该设备上执行图像处理任务。

TE3511 | TwinCAT 3 Analytics Energy
TwinCAT 3 Analytics Energy 提供了一种选项,可以通过简单的图形化表示来配置和测试应用程序中的电能系统分析算法。用户无需具备编程技能。只需按下按钮,即可从配置中自动生成基于 TF3650 和 TF83xx 系列产品的 PLC 代码,以及基于 HTML 的图形用户界面。生成的代码可用于持续监测电流和电压的有效值、频率、谐波及其它特征值,以评估电网质量。一个特别的优势在于,该分析功能还可以直接与 I/O 配置相关联,因此在需要时,用户只需使用一个 TwinCAT 项目即可。

TE3512 | TwinCAT 3 Analytics Condition Monitoring
TwinCAT 3 Analytics Condition Monitoring 提供了一种选项,可以通过简单的图形化表示来配置和测试应用程序中的机械及电气组件分析算法。用户无需具备编程技能。只需按下按钮,即可从配置中自动生成基于 TF3600 Condition Monitoring 软件库的 PLC 代码和基于 HTML 的图形用户界面。生成的代码可用于持续监测设备组件。一个特别的优势在于,该分析功能还可以直接与 I/O 配置相关联,因此在需要时,用户只需使用一个 TwinCAT 项目即可。

TE3520 | TwinCAT 3 Analytics Service Tool
TwinCAT 3 Analytics Service Tool 是一款 TwinCAT 3 开发环境产品,用于分析评估实时和/或历史数据。这些数据可来自多种应用场景,例如工业设备、楼宇系统或能源设施等。Service Tool 的配置集成在 Microsoft Visual Studio 中,并以图形用户界面的形式呈现。工具箱提供多种用于配置分析的算法选项:

TF3500 | TwinCAT 3 Analytics Logger
TwinCAT 3 Analytics Logger 确保周期性地同步采集设备控制器中的过程和应用数据。该款记录工具具有高性能特点,因为它直接在 TwinCAT 控制器的实时环境中运行。采集的数据可选择通过物联网通信协议 MQTT 传输至消息代理,或存储在设备控制器硬盘上的某个本地文件中,并通过环形缓冲区功能进行记录。为此所需的配置在 Microsoft Visual Studio® 中的 TwinCAT 项目内完成。可以通过复选框轻松将过程映像的所有变量和 PLC 应用程序添加到配置中,无需编程。

TF3510 | TwinCAT 3 Analytics Library
TwinCAT 3 Analytics Library 是具有大量分析功能和应用程序数据的 PLC 功能库。该功能库可以在设备控制器上使用,也可以在具有物联网通信连接的远程分析系统上使用。在这两种应用场景中,TE3500 TwinCAT 3 Analytics Workbench 的 PLC 代码自动生成功能可以节省大量开发时间。对于本地使用,只有映射需要手动进行;而在物联网工作流程中,甚至映射也可以省略并自动完成。

TF3520 | TwinCAT 3 Analytics Storage Provider
TwinCAT 3 Analytics Storage Provider 是一个 MQTT 客户端,在一个或多个 MQTT 消息代理和相关数据存储单元之间提供了一个接口。各种控制器都可以通过 MQTT 发送数据,然后由 Storage Provider 集中存储。这些数据可以是周期性原始数据,也可以是预处理数据。历史数据也通过 Storage Provider 导入。因此,Storage Provider 可以为服务技术人员输出开发环境中的数据,或通过交互式图表为生产管理人员输出 Analytics 图形用户界面中的数据。

TF3550 | TwinCAT 3 Analytics Runtime
TwinCAT 3 Analytics Runtime 是一个 Runtime “容器”,用于运行在 TE3500 TwinCAT 3 Analytics Workbench 中配置和开发的 Analytics 应用程序。Runtime 可以安装在本地、远程硬件或虚拟机中。它还包含 TF2000 TwinCAT 3 HMI Server,用于托管 Analytics 图形用户界面。总的来说,TwinCAT 3 Analytics Runtime是一系列不同的授权。它包括 PLC 实时核、Analytics PLC 软件库、通过 MQTT 和 HTTPS/Rest 实现的物联网连接、Storage Provider 连接、TwinCAT 3 HMI Server 以及相应的客户端软件包,以便多个用户可以同时查看所设计的 Analytics 图形用户界面。


